The Snellen Chart is the most commonly used eye test to measure visual acuity (clarity of vision).
1. What is a Snellen Chart?
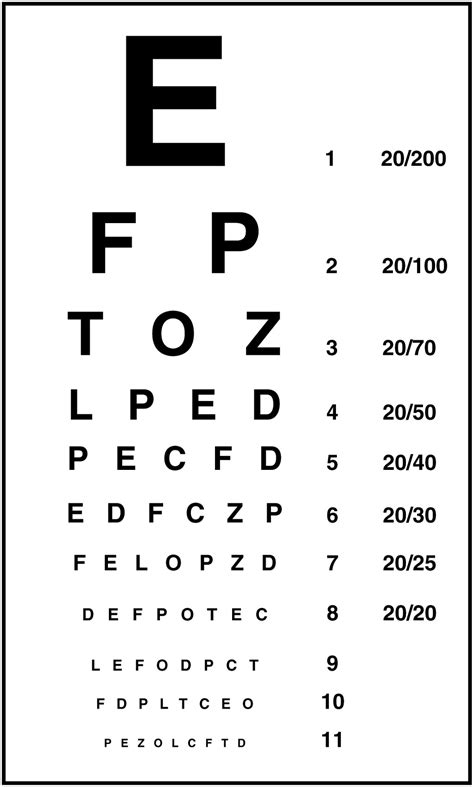
- It is a chart with rows of letters, decreasing in size as you move downward.
- The largest letter (usually “E”) is at the top.
- Each row is labeled with a fraction (e.g., 6/6, 6/12, 6/60, etc.), indicating visual clarity.
2. How to Use the Snellen Chart?
✅ Step 1: Stand 6 meters (20 feet) away from the chart.
✅ Step 2: Cover one eye and read aloud the smallest line you can see.
✅ Step 3: Repeat the test with the other eye.
✅ Step 4: The examiner records the smallest readable line and notes your vision as 6/x (or 20/x in feet).
3. Understanding the Snellen Fraction
| Snellen Fraction | Meaning | Example |
|---|---|---|
| 6/6 (20/20) | Normal vision | You can see at 6m what a normal person sees at 6m |
| 6/12 (20/40) | Mild visual impairment | You need to be 6m close to see what a normal person sees at 12m |
| 6/60 (20/200) | Legally blind (without correction) | You see at 6m what others see at 60m |
4. What If the Vision is Poor?
- If vision improves with a pinhole test → Refractive Error (needs glasses).
- If vision does NOT improve → Possible eye disease (cataract, glaucoma, retinal disease).